FTP (Functional Threshold Power) vs FTC (Functional TORQUE CURVE) when riding a bicycle
First thing is first. In Physics, POWER is not synonymous with FORCE!
FORCE - is any interaction that, when unopposed, will change the motion of an object.
TORQUE - is a rotational force that appears at the fixed end of an arm when a force is applied at the other arm's end that is perpendicular to it.
The value of that torque is equal to the product between the arm's length, expressed in meters (m) and the force's modulus (value), expressed in Newtons (N), the resulting measuring unit being Newtons meter (Nm).

POWER - in rotational systems, is the product of the torque and angular velocity W = Nm * rad/s.
1 RPM = 0.10472 rad/s
Instead of using FTP(Functional Threshold Power) as a reference, a MORE ACCURATE reference would be Functional TORQUE CURVE, expressed in Nm depending on RPM.
That means that we remove, say, the "force distortion"(see the conclusion) inserted by POWER, and we look at the Torque Graph values in Nm in relation with RPM.
Functional TORQUE CURVE can be measured by riding just like in the case of measuring the Functional Threshold Power, BUT the calculation should be done with the force applied by the cyclist in the pedals combined with the pedal arm length and the RPM of the pedals.
FTP (Functional Threshold Power) example, with 170 mm pedal arm length and 668 mm wheel diameter:
1. In order to develop 40 Nm, that means that the force with which the rider is pushing on the pedals is 235.3 N or 23.99 kgf, he should generate:
- 418.88 W at 100 RPM
- 377.99 W at 90 RPM
- 335.10 W at 80 RPM
and so on...
So, in the same gear ratio:
I. For 53-11, the gear ratio is 0.20754716981132 and the force's coefficient is 0.10702495917778.
EACH OF THE ABOVE POWER VALUES generate a traction force of 25.18 N or 2.57 kgf
II. For 39-22, the gear ratio is 0.56410256410256 and the force's coefficient is 0.2877847346525.
EACH OF THE ABOVE POWER VALUES generate a traction force of 72.90 N or 6.90 kgf.
2. In order to develop 418.88 W, the rider should generate:
- 40.00 Nm at 100 RPM
- 44.44 Nm at 90 RPM
- 50.00 Nm at 80 RPM
and so on...
So, in the same gear ratio like:
I. For 53-11, the gear ratio is 0.20754716981132 and the force's coefficient is 0.10702495917778.
EACH OF THE ABOVE TORQUE VALUES generate a DIFFERENT traction force of:
- 40.00 Nm at 100 RPM => force of 235.3 N or 23.99 kgf => traction force of 25.18 N or 2.57 kgf
- 44.44 Nm at 90 RPM => force of 261.41 N or 26.65 kgf => traction force of 27.97 N or 2.85 kgf
- 50.00 Nm at 80 RPM => force of 294.11 N or 29.99 kgf => traction force of 31.47 N or 3.21 kgf
As you can see, the same power has different traction force values for the same gear ratio, depending on RPM.
So, 418.88 W can be converted in 3 or more values of traction force in the same gear ratio if the rotational speed of the pedals changes (and thus, the speed changes).
FTC (Functional TORQUE CURVE) example with 170 mm pedal arm length and 668 mm wheel diameter:
If the rider develops an average of 40 Nm at the pedals, that means that the force with which he is pushing on the pedals is 235.3 N or 23.99 kgf.
The force's coefficient specific for each gear ratio, found for example with marius-ciclistu's Bike Transmission Calculator and Comparator, can be then used to determine the traction force:
I. For 53-11, the gear ratio is 0.20754716981132 and the force's coefficient is 0.10702495917778.
The resulting traction force is 25.18 N or 2.57 kgf
II. For 39-22, the gear ratio is 0.56410256410256 and the force's coefficient is 0.2877847346525.
The resulting traction force is 72.90 N or 6.90 kgf
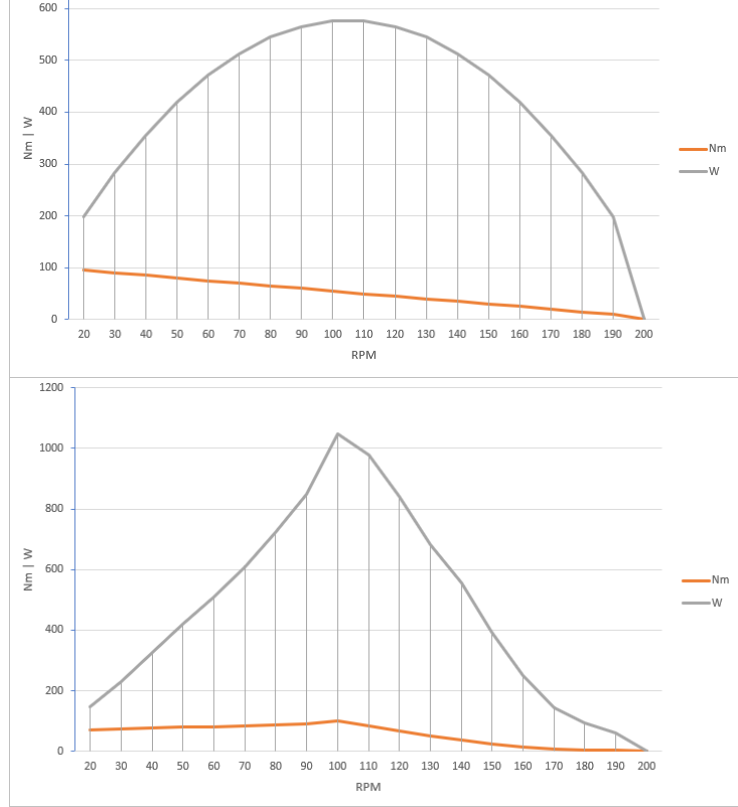
But the cyclist generates a torque graph that depends on the RPM of the pedals, not a constant torque value:
Example of torque graphs:

So, the above calculation must be done for each rpm change, resulting in a traction curve that is ALWAYS direct proportional with the torque curve. Basically it’s torque multiplied by a constant for each gear ratio.
You can see such calculations in marius-ciclistu's Car Transmission Calculator and Comparator, but in the case of thermal engines, the torque graph is the same if the conditions don’t change, as in the human case the torque graph changes because of fatigue etc.


